
Blog
China Best Industrial Solar Solutions for Global Buyers?
Industrial buyers comparing China’s best industrial solar solutions need more than a low module price. They need dependable output, clear warranties, and equipment suited to demanding sites. A factory roof, warehouse, or remote processing plant each brings different loads, structures, and operating constraints.
The market is expanding quickly. IRENA’s Renewable Capacity Statistics 2024 records 346 GW of global solar capacity added in 2023, bringing total capacity to about 1,419 GW. That scale creates choice, but it does not guarantee a good project. IRENA’s Renewable Power Generation Costs in 2023 reports a global weighted-average cost of USD 0.044 per kilowatt-hour for newly commissioned utility-scale solar PV, 56% below the weighted average cost of fossil-fuel-fired alternatives. These figures are useful context, not a promise of savings for every industrial site.
The stakes are real. For global buyers, the strongest supplier is not automatically the one with the largest factory or lowest quotation. Check module degradation data, inverter compatibility, production references, delivery terms, and access to technical support. Ask how performance assumptions account for heat, dust, shading, and downtime. Numbers help. Yet system design and installation quality can matter just as much as the panels themselves. A careful comparison should weigh lifetime energy yield and serviceability alongside upfront cost. Even then, forecasts remain forecasts; site conditions can expose gaps that a polished proposal misses.
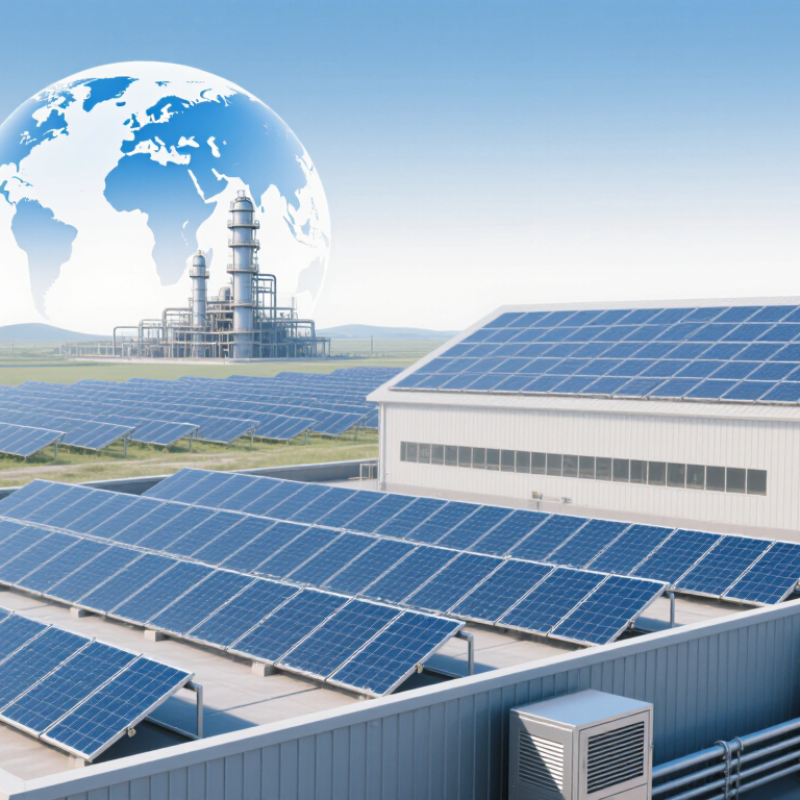
Industrial Solar Energy Needs Across Different Industries
Industrial Solar Energy Needs Across Different Industries
Industrial solar must fit the work, not just the roof. A factory running daytime shifts may use solar directly for motors, compressors, and cooling. Cold-storage facilities need dependable power after sunset, so batteries or grid support may matter. Food processors also face seasonal peaks and heat-intensive processes. Electricity alone may not cover every energy need.
The International Energy Agency’s Energy Efficiency 2023 report says industry accounts for about 37% of global final energy consumption. That scale makes efficiency and careful load matching important. A site assessment should examine hourly demand, roof strength, dust, shading, and equipment downtime. Small details matter. A dusty roof can quietly cut output.
Mining sites and remote plants may value solar because delivered fuel can be costly or uncertain. Warehouses, by contrast, often offer broad roofs and daytime cooling loads. IRENA’s Renewable Power Generation Costs in 2023 reports a global weighted average cost of $0.044 per kilowatt-hour for newly commissioned utility-scale solar PV. This is a useful benchmark, not a factory-specific price. One uncomfortable point: solar forecasts can look precise while actual production varies with weather, maintenance, and site conditions. Planning around that gap is essential.
China Best Industrial Solar Solutions for Global Buyers? - Industrial Solar Energy Needs Across Different Industries
| Industry | Typical Electricity Demand Pattern | Common Solar Configuration | Indicative Project Capacity | Key Design Considerations | Battery Storage Role |
|---|---|---|---|---|---|
| Manufacturing and Assembly | Steady weekday demand, often concentrated during daytime shifts; some facilities operate around the clock. | Rooftop or carport solar connected behind the meter; ground-mounted solar may suit sites with available land. | Approximately 100 kW to 10 MW, depending on roof area, site size, and electrical demand. | Assess roof structure, production schedules, transformer capacity, power quality, and planned facility expansion. | Can help manage demand peaks or provide limited backup when paired with suitable controls; it is not a substitute for a properly designed emergency power system. |
| Food and Beverage Processing | Daytime processing demand may coincide well with solar generation; refrigeration can create substantial and continuous loads. | Rooftop solar combined with energy monitoring; consider carports or ground-mounted arrays where roof space is limited. | Approximately 100 kW to 5 MW, subject to site conditions and load profile. | Coordinate solar output with refrigeration, cold storage, sanitation, and process schedules; check rooftop hygiene and maintenance requirements. | May support peak management or selected critical loads, subject to refrigeration requirements and backup design. |
| Warehousing and Logistics | Large daytime loads can come from lighting, conveyors, ventilation, and electric vehicle charging; demand varies by operating hours. | Large rooftop arrays and solar carports; integrate charging equipment with site energy management where appropriate. | Approximately 100 kW to several MW, depending on usable roof and parking area. | Check roof condition and loading, fire-access routes, charging schedules, and the electrical capacity available for future fleet electrification. | Can shift some solar energy to later charging periods or reduce selected peaks; economics depend on tariffs and charging patterns. |
| Textiles and Apparel | Demand is often driven by motors, compressed air, lighting, and ventilation during production shifts. | Rooftop solar with efficiency measures and submetering of major production loads. | Approximately 100 kW to 3 MW, depending on factory scale and roof suitability. | Review dust, humidity, roof condition, production shifts, and the effect of variable-speed equipment on the load profile. | Optional where evening operations, demand charges, or backup needs justify the additional system cost. |
| Chemicals and Process Industries | Often continuous or near-continuous demand, with substantial process loads and strict operational requirements. | Behind-the-meter solar designed around process loads; ground-mounted systems may be considered where land and interconnection allow. | Approximately 500 kW to 20 MW or more for large sites; feasibility is highly site-specific. | Require detailed electrical and process-safety reviews, hazardous-area assessment where applicable, and careful planning for grid interconnection. | May provide grid services or support selected loads, but must be engineered to meet process-safety and continuity requirements. |
| Data Centers and Digital Infrastructure | High, continuous demand with critical uptime requirements; cooling loads can vary with weather and utilization. | On-site rooftop or ground-mounted solar as a supplement to grid supply and other backup systems. | On-site arrays range from hundreds of kilowatts to several megawatts, limited by available land and roof area. | Model hourly generation against continuous demand; coordinate controls and interconnection with the facility’s reliability architecture. | Battery systems can support specific grid or resilience strategies, but require separate sizing and integration with established backup systems. |
| Mining and Mineral Processing | Demand may be continuous and equipment-intensive; remote sites can face constrained or costly electricity supply. | Ground-mounted solar, often considered alongside grid supply or hybrid generation at suitable sites. | From hundreds of kilowatts to tens of megawatts, depending on mine scale, land, and grid access. | Evaluate dust, extreme temperatures, terrain, transport access, grid conditions, and the mine’s operating and closure plans. | Can help smooth variable generation or reduce reliance on other generation sources; hybrid controls and reserve planning are essential. |
| Agriculture and Greenhouse Operations | Seasonal demand may include irrigation pumps, ventilation, heating, cooling, and produce handling. | Rooftop, ground-mounted, or appropriately designed solar canopies; system choice should preserve land and operational access. | Approximately 20 kW to several MW, depending on farm size and equipment demand. | Match generation to irrigation and seasonal schedules; assess shading, water exposure, equipment access, and land-use constraints. | May help supply loads outside solar hours, especially where grid access is limited; size against actual seasonal demand. |
Planning note: Capacity ranges are illustrative early-stage planning estimates, not industry standards or guaranteed project sizes. Final system sizing depends on interval electricity data, usable installation area, local solar resource, structural and electrical assessments, tariffs, grid-interconnection rules, and applicable regulations.
Related Posts
-
What Are the 2026 Top Industrial Solar Panel Types?
-
What Is Solar Power and How Does It Work?
-

The Ultimate Showdown of Solar Modules Performance Efficiency and Durability
-

The Future of Future Solar Technology and Its Impact on Renewable Energy Trends
-

Innovative Green Solar Energy Solutions Showcased at China Import and Export Fair 2025
-

10 Essential Tips for Choosing the Right Solar Module for Your Home